Example Model
Small test models
We tested Model Balancing extensively with three small test models. Model and data files, as well as results for various estimation scenarios can be found on our GitHub repository named model-balancing.

Figure 1: Model of E. coli central carbon metabolism, taken from Noor et al. [1].
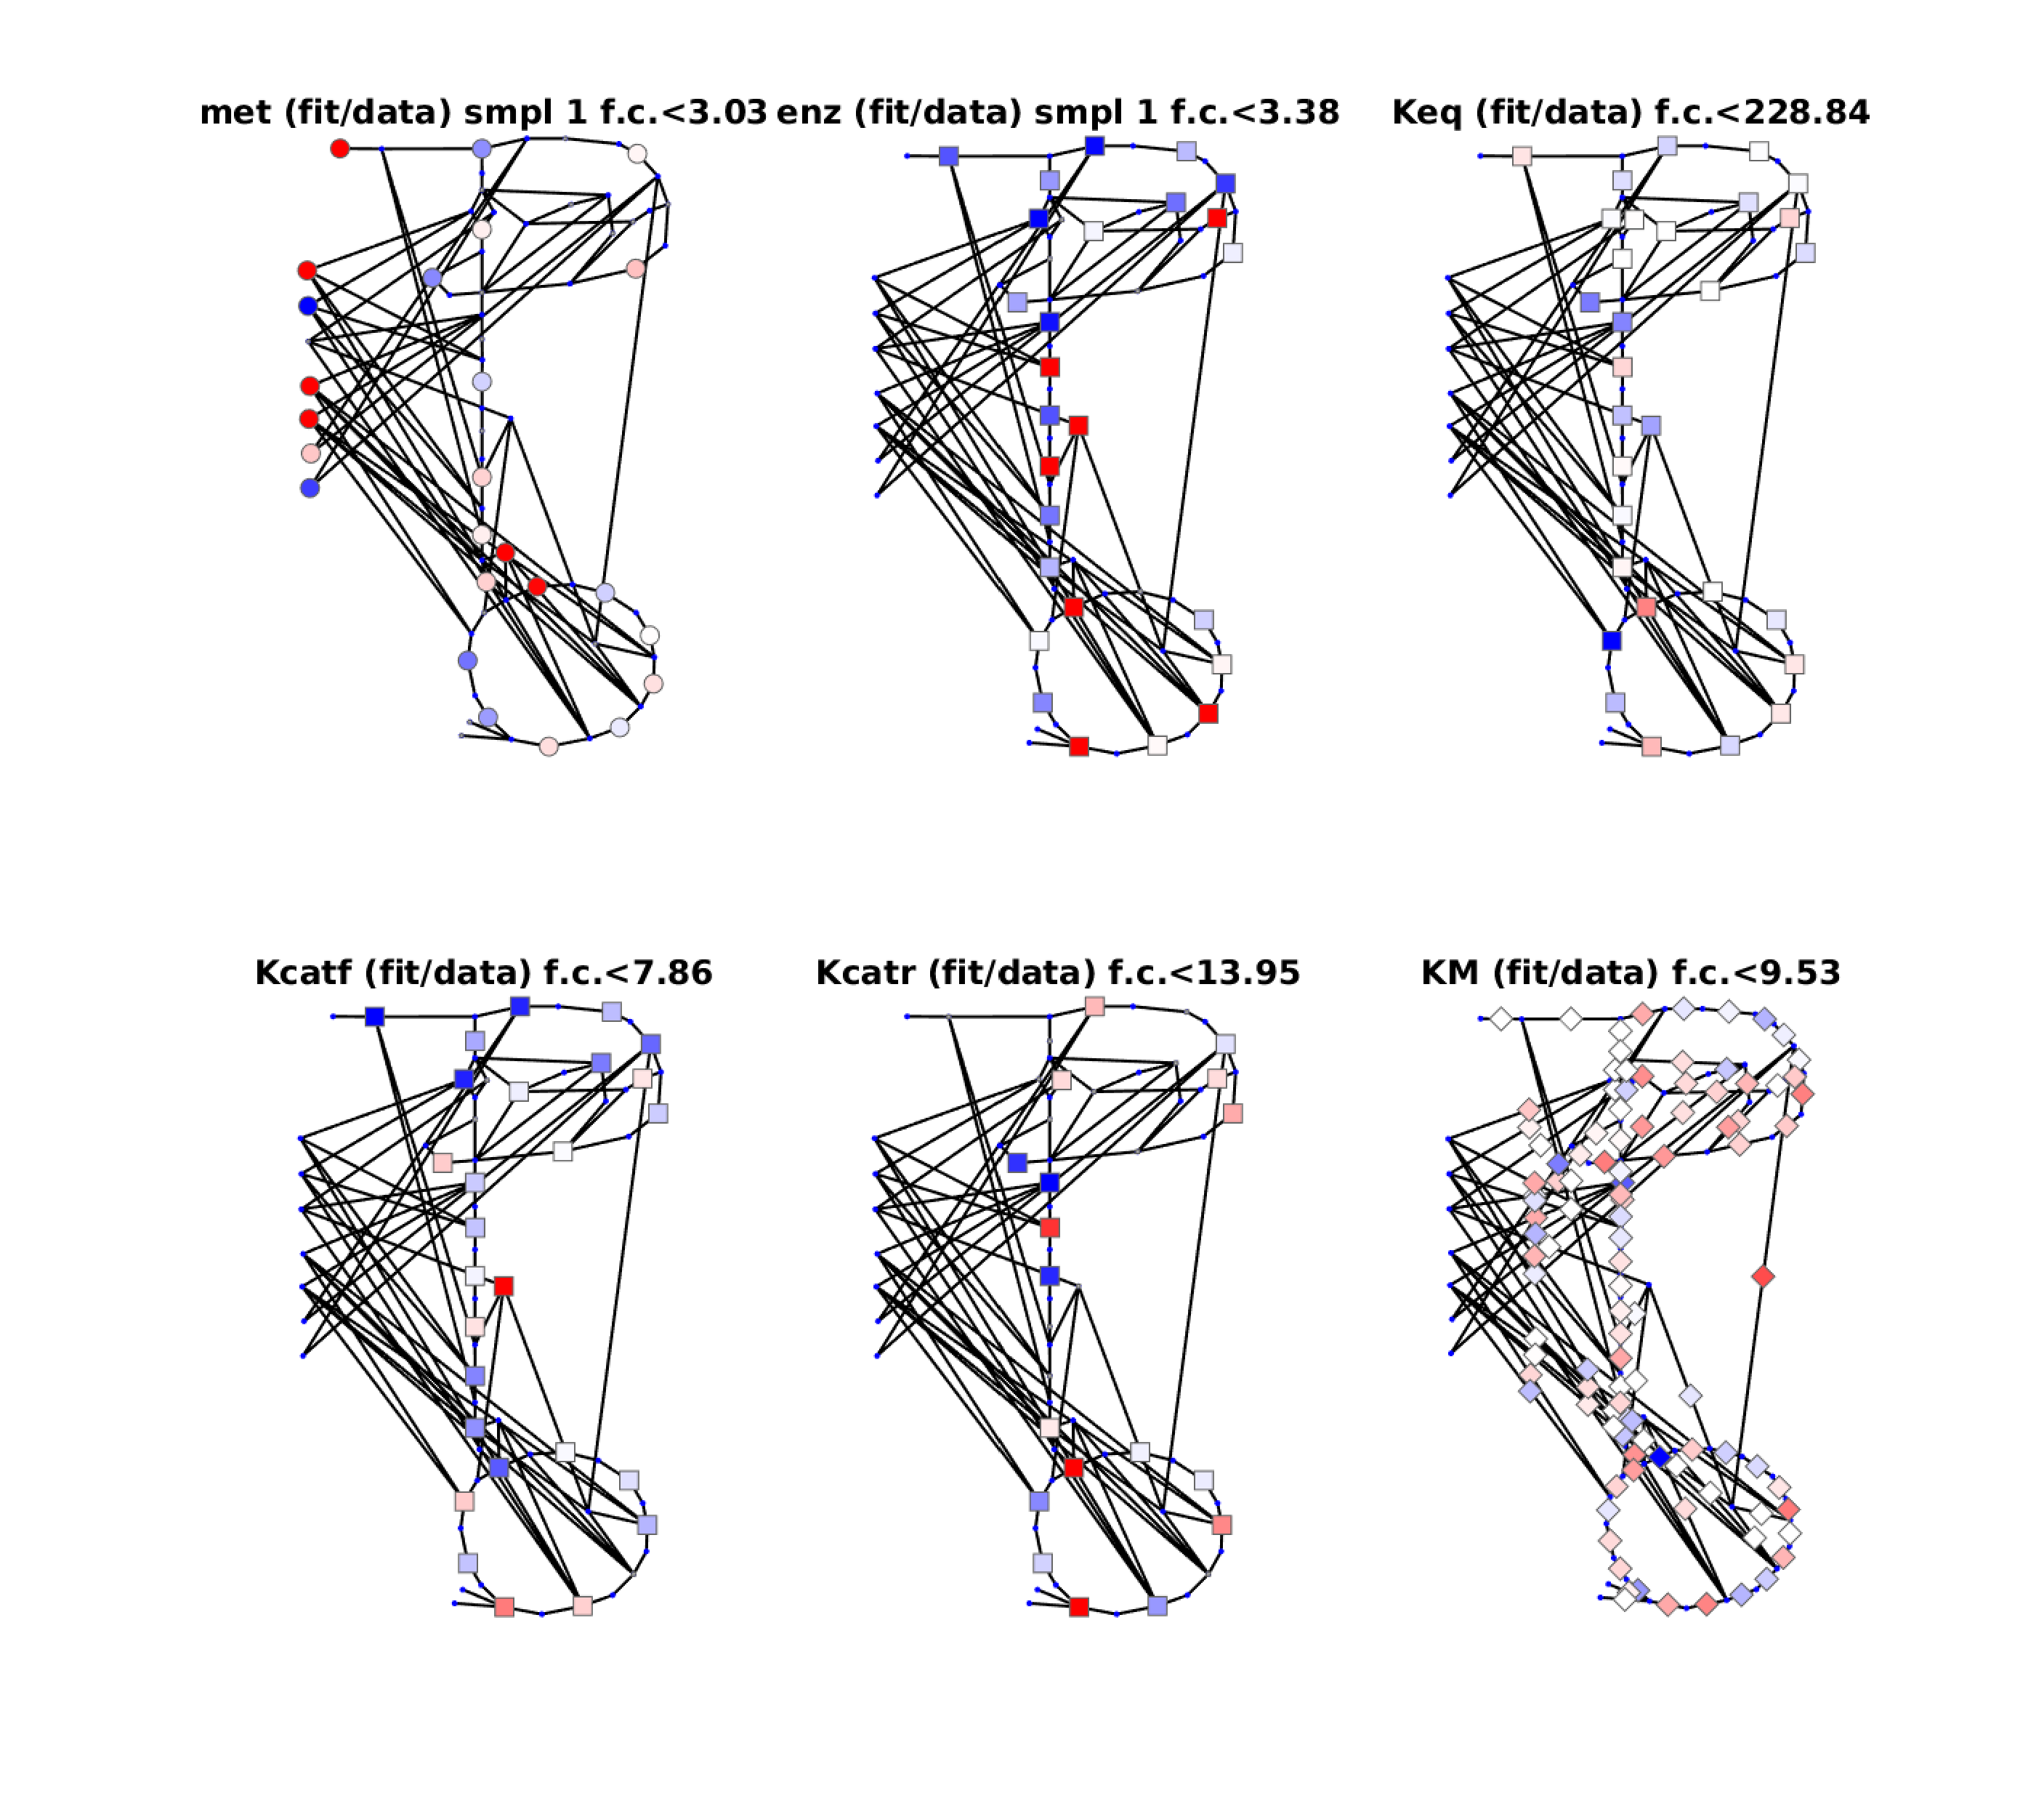
Figure 2: Diagnostic plots for fit with original kinetic data. Colors indicate relative fitting errors. Blue: fitted value too high. Red: fitted value too low. Maximal fold changes (whether up or down) are given by numbers. For more examples, see the resources/models folder.
E. coli model
The model of E. coli central carbon metabolism from Noor et al. [1] comprises 40 metabolites and 30 reactions and contains 107 \(K_{\rm M}\) values and 167 kinetic constants (\(K_{\rm M}\) values, as well as forward and backward \(k_{\rm cat}\) values). The model structure (Figure 1) is defined by the file e_coli_noor_2016.tsv. In-vitro kinetic data had been mapped to the E. coli model in Noor et al. [1]. Here we used the same data with a few changes. In addition, we generated a balanced version of the same data set, also taken from Noor et al. [1]. For details about the model, see the documentation on github (numbers of data values model variables estimated can be found in the report files). To model aerobic growth on glucose, we used state data from Noor et al. [1] which include measured flux data from van Rijsewijk et al. [2], proteomics data from Schmidt et al. [3], and metabolomics data from Gerosa et al. [4]. To model several metabolic states, we used a data set from Davidi et al. [5], where a larger network model had been considered, proteomics data from different sources were used, and flux data had been computed by FBA. I linearly the flux data onto the E. coli model to obtain complete and consistent flux values. A comparison between the two data sets reveals a discrepancy in scaling: the (FBA-derived) fluxes from Davidi et al. [5] were smaller than the fluxes taken from Noor et al. [1] by an approximate factor of 10, while enzyme concentrations were smaller by an approximate factor of 2.